Initial hacking of GHC for GCC link-time optimization
Last updated: Jan 3, 2025
I spent some time hacking GHC to use GCC’s link-time optimization, and wanted to share the results. The idea was to see whether we could get performance gains or other interesting results from :
- cross module inlining, e.g. between C libraries from
baseand the RTS - GCC build flags that can only be added later, like
-march=nativeto tailor optimizations to our microarchitecture - possibly nice interactions at barrier of haskell code and LTO’d C?
This was all very speculative, and the results you see below aren’t ultimately very interesting.
The change is pushed to this branch
and you can check out the commit or cherrypick it here: 6f369534.
It’s full of hacky workarounds, notes and scratch work (some of which isn’t
relevant at all), my build.mk is included, etc.
Notably hacky is the use of shim executables for gcc,
etc. after I found GHC’s build system wasn’t respecting flags or doing what I
was expecting.
Hacking GHC
All the ugly details are in the changeset and I won’t go over most of, but essentially the process was:
- compile with
-flto -fno-fat-lto-objects(see shim), and keep fixing or working around things until the build completes - verify that LTO seemed to have worked by looking for
gnu.ltosections, e.g. withfor f infind . -name ‘*.o’; do grep -q gnu.lto <(readelf -Wa "$f") && echo "$f"; done 2>/dev/null - finally recompile GHC again with
-ffat-lto-objectsso that we can compile our own haskell programs, choosing to use LTO or not
“Fat LTO objects” are regular object files which have a special sections containing gcc’s GIMPLE IR, and other stuff it needs, so that they can be compiled normally (even by e.g. clang) or take advantage of LTO by invoking gcc from the linker. The downside is they make it difficult to be sure LTO is really happening.
Compiling haskell using hacked GHC
You can use a local GHC tree from cabal as follows:
$ cabal --with-compiler=SOMEDIR/ghc/inplace/bin/ghc-stage2 --package-db=SOMEDIR/ghc/inplace/lib/package.conf.d ...
I found it was pretty obvious when LTO was working and when we were
(successfully) falling back to normal compilation using the “fat” part of our
“fat objects” because the LTO build would bizarrely spit out a Werror warning
from ghc libraries (that I couldn’t figure out how to silence, but which didn’t
actually cause an error).
libraries/ghc-prim/cbits/atomic.c:219:10: error:
     note: ‘__sync_fetch_and_nand’ changed semantics in GCC 4.4
Also interestingly linking took notcieably longer with LTO, but only by a few seconds.
To build using the hacked GHC but without doing LTO this worked:
$ cabal new-build --ghc-option=-optl-fno-lto` ...
…but again we need the shims in our path.
…and Using PGO
GCC can perform profile-guided optimization by recompiling and optimizing with a performance profile collected from the program to be (re)compiled. The result might be better decisions re. inlining or locality. This was a good PGO tutorial that covers some gotchas that I encountered.
We can generate a profile using AutoFDO
from data collected by perf, which means the binary doesn’t have to be built
with expensive instrumentation (which also might throw off the resulting
performance profile).
The general steps looked like:
$ cabal new-build ...
$ perf record -b <hlint ...>
[ perf record: Woken up 20 times to write data ]
[ perf record: Captured and wrote 5.125 MB perf.data (12379 samples) ]
$ create_gcov --binary=dist-newstyle/build/x86_64-linux/ghc-8.6.3/hlint-2.0.12/x/hlint/build/hlint/hlint --profile=perf.data --gcov=/tmp/perf.data.gcov -gcov_version 1
Then we rebuild hlint after first modifying our gcc shim by adding
-fauto-profile=/tmp/perf.data.gcov, and removing -flto.
Results
I used as a test hlint, compiled in various ways, running over the lens
codebase. The variations I measured (again by passing different args in the
gcc shim, which stayed in my PATH) were
-O2(a flag already in the shim when we built GHC)-Os(optimize for small code size)-O2with profile-guided optimization (see below for a walk-through)-march=native -O2, and-march=native -O3for auto-vectorization and magic ponies
I was hopeful the last two results would be interesting, since for a very slight increase in compile time users could tune the RTS to their microarchitecture in a way that GHC HQ cannot when preparing binary distributions, for instance.
As I mentioned the results were not too exciting:
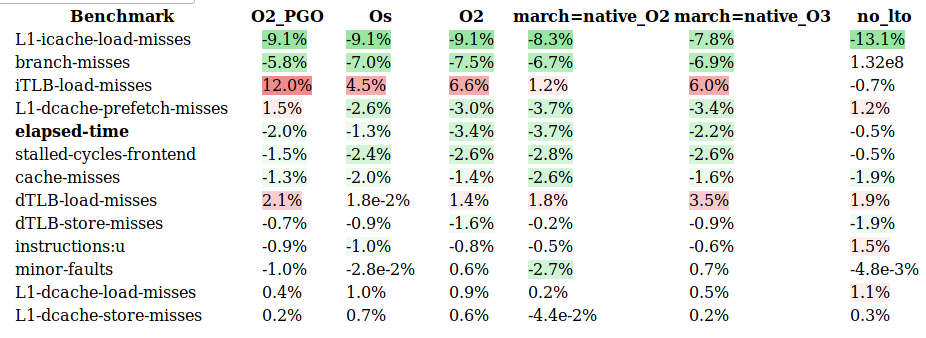
Some notes:
- timing and metric collection was done with several runs of
perf stat --repeat=5 -e event1,event2,...limiting number of events we passed toperfso it didn’t need to sample - standard deviation for
minor-faultswas 3 - 5%, all others were < 1.5% - number of allocations and GCs were identical
- I suspect that the regular
O2and twomarch=nativeversions were essentially the same (they all have exactly the same stripped size), although I didn’t look more closely at it.
On the last point, the manual states that “it is generally ineffective to specify an optimization level option only at link time and not at compile time”, though I can’t find much detailed guidance on that.
Interpreting Benchmarks
We’re interested in elapsed-time and how the other metrics might be
correlated with it. The percentage improvements are relative to hlint compiled
with stock ghc. The no_lto benchmark is hlint compiled with our hacked GHC
but without LTO enabled (see above).
We can see a very small improvement in runtime. This might be attributable to the smaller number of branch misses, or something else entirely…
For the most part no_lto is acting as a useful control. It mostly tracks very
closely to the performance of stock-ghc-compiled-hlint.
I’m not sure what to make of the instruction cache misses (this tends to be
somewhat high in GHC code so I was interested). In sum the perf metrics don’t
provide me much insight.
It’s not surprising that LTO doesn’t provide a huge benefit since only a small (but important) part of a haskell program originated from C. I’m not sure whether any optimizations become possible for haskell code linking with fat LTO objects, but likely not.
Final note: ghc itself seems to dynamically link its runtime and other libraries, so I’m not sure it could fully benefit from LTO (if there were any significant benefit).
Inspecting the code
I wanted to find at least one example of LTO that I could understand and present. I took the opportunity to start learning a new tool for me: radare2. This tutorial walkthrough was really helpful.
First since I was mostly interested in the runtime I compiled two “Hello world” programs, both with my patched GHC, one with LTO and one without.
Here are the stripped sizes:
821016 hello_lto
768280 hello_no_lto
I spent some time trying to use radiff2
to compare the files, which claimed to find thousands of differences while
printing screenfulls of unpleasant messages about “anal threshold”.
I ended up trying to diff various hot functions
$ radiff2 -AC hello_lto hello_no_lto
...
                  sym.evacuate1   189 0x405bd0 | UNMATCH  (0.888889) | 0x408110    189 sym.evacuate1
sym.scavenge_block1.lto_priv.90  3327 0x408c10 |     NEW  (0.000000)
            sym.scavenge_block1  3117 0x4050a0 |     NEW  (0.000000)
...

$ radiff2  -g sym.evacuate1 hello_lto hello_no_lto | xdot -
I saw some instruction reordering (maybe due to an implicit -march=native
making different pipelining decisions?), but nothing very interesting.
I went back and browsed the radiff2 instruction list, this time paying
attention to size differences (hoping to see inlining). This gave me a jumping
off point to start poking with r2 (the main radare forensics program), and I
found getMonotonicNSec and getProcessElapsedTime formed a nice example.
In rts/ in the GHC tree we can see this code:
StgWord64 getMonotonicNSec(void)
{
    struct timespec ts;
    int res;

    res = clock_gettime(CLOCK_ID, &ts);
    if (res != 0) {
        sysErrorBelch("clock_gettime");
        stg_exit(EXIT_FAILURE);
    }
    return (StgWord64)ts.tv_sec * 1000000000 +
           (StgWord64)ts.tv_nsec;

}

Time getProcessElapsedTime(void)
{
    return NSToTime(getMonotonicNSec());
}
Asking r2 to print what it thinks is the disassembly of this function in the
non-LTO version of our hello.hs:
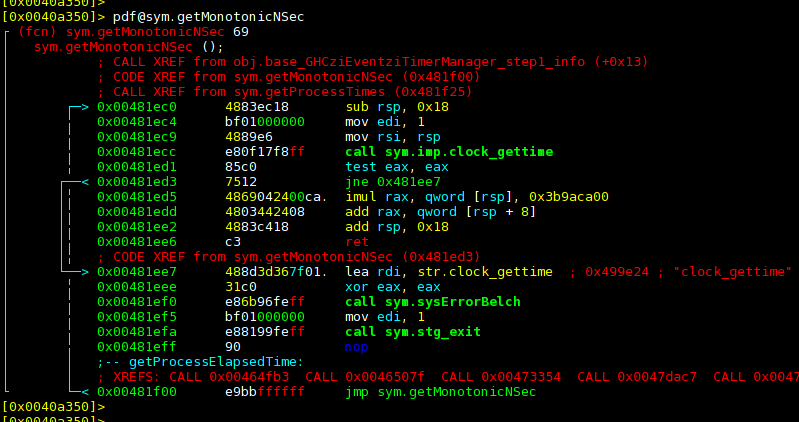
We can see a few things here:
- radare seems to be confused and thinks that
getMonotonicNSecis recursive, because the function that follows (getProcessElapsedTime) is optimized into ajmp. So it just displays the label corresponding to that function as a turquoise little comment. r2is telling us about two different callers ofgetMonotonicNSecand a few different callers ofgetProcessElapsedTime(…which it doesn’t think is a function…?)
We can jump (like ls in a shell) to the first of the callers of
getProcessElapsedTime, and again ask r2 to print the function we’re in.
Again, this is the non-LTO binary:
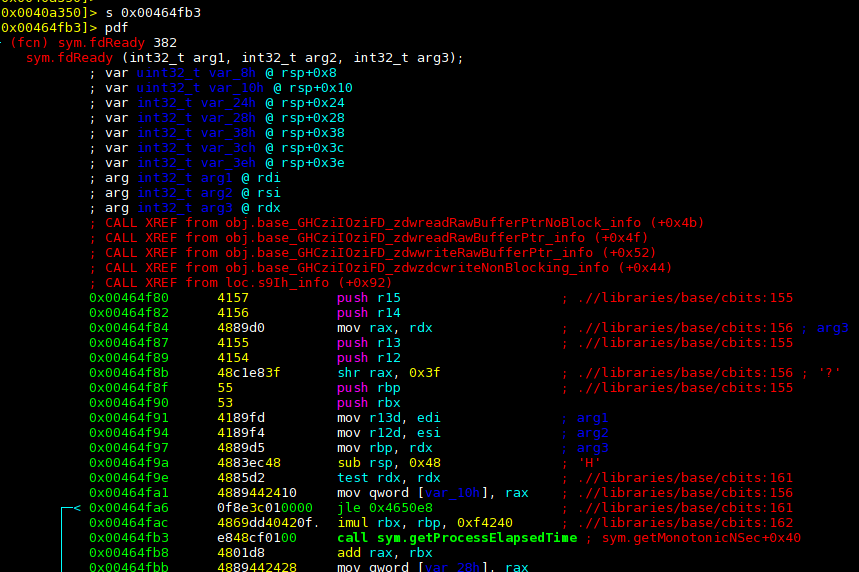
So r2 thinks we’re in a function called fdReady() and we call sym.getProcessElapsedTime towards the bottom there.
We can again reference the GHC source and find in libraries/:
int
fdReady(int fd, bool write, int64_t msecs, bool isSock)
{
    bool infinite = msecs < 0;
    // ... SNIP ...
            if (!infinite) {
                Time now = getProcessElapsedTime();
                remaining = endTime - now;
            }
    // ... SNIP ...
}
Okay, so that all makes some sense; the libraries (and the C bits in them)
shipped with GHC are compiled separately from (and before?) the RTS code.
While we can see there is some indirection here, it makes sense that this
couldn’t be optimized away (but see conclusion for more).
Let’s look at the LTO version of our hello.hs:
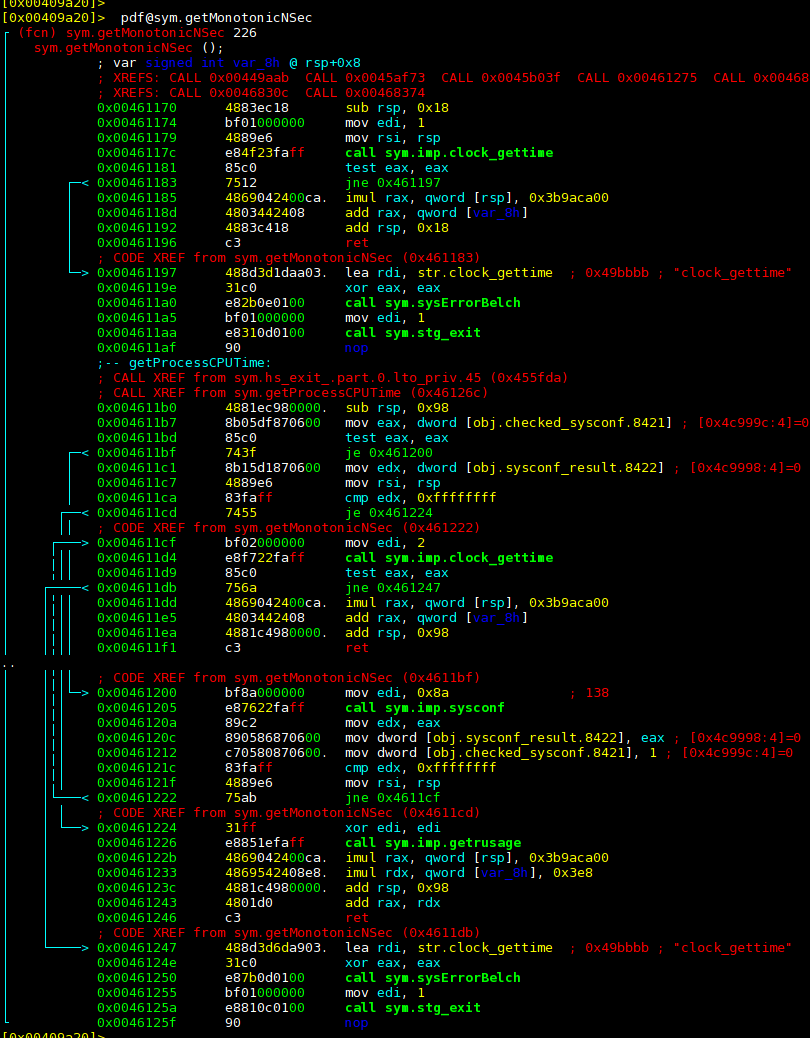
So we can see again (after some head scratching already accomplished), that
r2 can’t figure out where getMonotonicNSec ends. But we also don’t see
getProcessElapsedTime at all. Indeed if we ask r2 to print it we see it’s
not there:
[0x00409a20]> pdf@getProcessElapsedTime
Invalid address (getProcessElapsedTime)
|ERROR| Invalid command 'pdf@getProcessElapsedTime' (0x70)
Looking for the fdReady function that, in the non-LTO code, called
getProcessElapsedTime we see:
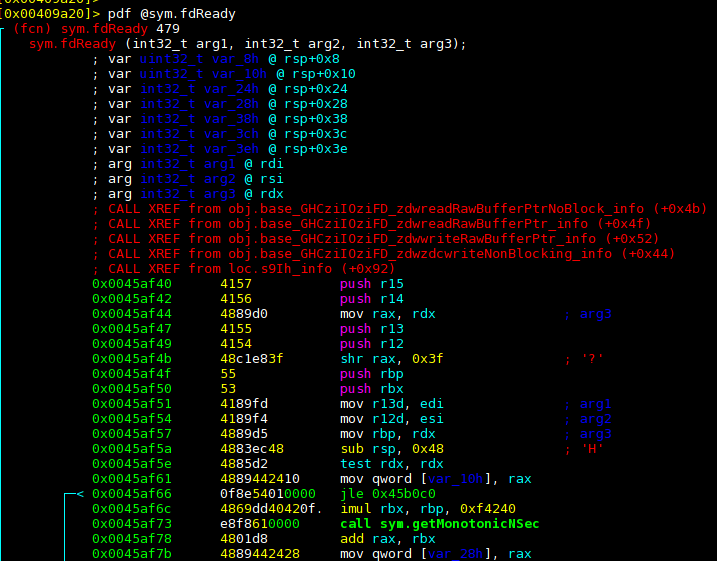
So fdReady is calling getMonotonicNSec and the jmp indirection that we
had in the non-LTO version has been optimized away. And across modules that
were compiled completely separately!
Conclusions and Future Work
Without demonstrating significant performance improvements I don’t think you can motivate supporting this in GHC.
It is nice though that this change could be added without breaking support for other C compilers (by using fat LTO objects), and (if using LTO) with very little increase in compile time.
Some misc possibilities:
- gcc LTO simply doesn’t have much to do since all the haskell code is (I think) opaque to the linker-compiler
- there are optimization barriers in the ghc build system; if we fixed them we would see more improvement
- better optimizations on the initial build side might yield improvements during LTO (i.e. it’s not clear to me what gcc does with flags passed during LTO vs in the original compilation)
- a different test case (maybe something less
IO-bound? Or something more IO-bound…?) might demonstrate more improvements - maybe PGO is not effective during LTO, and we’d see some benefits to, say, recompiling the RTS using a generic profile
- maybe things would work much better with new GCC (I’m using 6.3)
- maybe there are other arch-specific optimizations I didn’t try that are beneficial, but which can’t be performed when compiling the generic bindist; i.e. LTO is beneficial not for whole-program optimization, but just for deferring some compilation decisions.
The work also uncovered some quirks or posssible improvements to some of the C
code in the GHC tree. For instance there might be benefits to hiding symbols
in the RTS code; in our shim we use -fno-semantic-interposition as a big
hammer to do this, though I’m not sure what effect it had.
I’m not going to work more on this, but do plan on playing with LLVM’s LTO (which is how this project started out); I think I may have worked out the issue that blocked me in the course of this GCC LTO work. The interesting thing there is that theoretically we could get actual whole-program LTO on LLVM IR bitcode (since haskell has an LLVM backend).