17x17: Further Thoughts & Some Pretty Pictures
Last updated: Jan 2, 2025
Note: this is part of a series of posts is related to the “17x17 Challenge” posted by Bill Gasarch. The goal is to color cells of a 17 by 17 grid, using only four colors, such that no rectangle is formed from four cells of the same color.
An almost silly amount of time passes between my new ideas on this problem and investigating/coding those ideas, but I’m trying to be better about helping my thoughts see the light of day before I get entirely bored of them.
So in that spirit, here are a few more thoughts on the 17x17 Problem investigated.
Will Graph Layout Algorithms show Symmetry?
Force-based algorithms tend to be good at creating symmetrical layouts of graphs. The idea is to translate a Graph into a system of springs (edges) and charged particles (nodes). You then run a simulation of this 2-dimensional sytem and the graph eventually should work itself out into some equilibrium state.
At that point hopefully you get a layout which is more clear and perhaps makes clear some important relationships of the Graph.
I used the graphviz software suite to do the force-directed layouts and wrote some ugly code to coax some rectangle-free single-colorings into the graphviz file format. I hoped that some of the single- and double-symmetrical relationships that I noticed would emerge in the process.
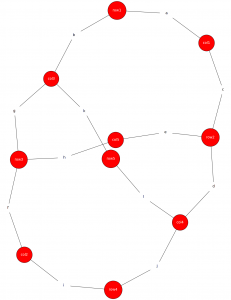
This worked perfectly for a small 5x5 cell single-coloring:

Since what we’re really looking for are symmetrical relationships between rows and columns rather than between cells, I’ve expressed the graph above as colored cell nodes connected to nodes representing the row and the column in which the cell resides.
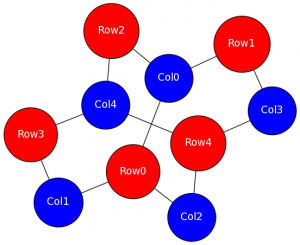
I realized I could tighten up the graph by getting rid of the nodes for the cells themselves and just showing Column nodes connecting to Row nodes, where an edge exists between the two when a colored cell lies on their intersection. (note: the rows and columns here don’t correspond to the ones above):

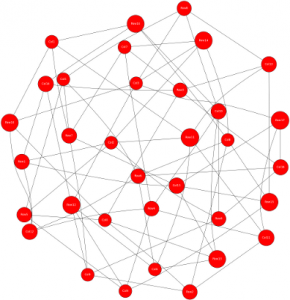
Unfortunately this wasn’t effective for the 17x17 single-coloring:

I suppose there were too many nodes and the symmetrical relationships are too tenuous to emerge. That said, I’m no graphviz expert so it’s quite possible that this could work with the right black magic.
Investigating Weights of Colored and “Toxic” Cells
Note: I’ve started calling cells which have been made un-colorable (because they would form a rectangle of that color) “toxic”; so that’s how I’ll refer to them here.
I wanted to investigate the relationships between colored cells and the cells that they make toxic (and vice versa), so I coded up a Haskell script that parsed a CSV format grid and did the following:
- For each colored cell, show the toxic cells that it has a part in making toxic
- For each toxic cell, list all the triplets of colored cells that each make this cell toxic
What I was primarily looking for were some insights that could lead to an heuristic to guide some kind of ladder-climbing search algorithm. For example if all the colored cells
The first point wasn’t particularly interesting to me: in the 17x17 grid of 74 colored, each colored cell helped toxify between 31 and 40 un-colorable cells, which corresponded with the number of row/column neighbors that a colored cell had.
What was more interesting was when I looked at the graph from the perspective of the toxic (blank) cells.
Each toxic cell had 3, 4 or 5 unique triplets of colored cells making it toxic. Here you can see a kind of heatmap with the toxic cells in shades of gray, corresponding to how many different 3-groups of colored cells help make this toxic:
An Obvious Property of Toxic Cells
Looking at toxic cells helped me realize an interesting property of those cells:
There is a one-to-one correspondence between a toxic cell’s row neighbors and its column neighbors in rendering the cell in question toxic.
That is for a toxic cell T a colored cell in T’s column will team up with
at most a single colored cell from T’s row (and vice versa) in toxifying our
cell. If this weren’t the case, it would imply a rectangle on our grid (you
can work it out on paper if you like).
To go further, this means that if T contains a colored cell in its row and
its column, both of which don’t contribute to making T toxic, then T is
essentially not doing it’s job as well as it can. That is we might be able to
add a new colored cell to form a triplet with those two colored cells, adding
a new colored cell to our graph and making T a more effective “rectangle
sink”.
Here’s an illustration of two different toxic cells and their respective (and partially overlapping) sets of toxifying triplets. The second tab shows how we might “improve” one of the toxic cells:
TODO: insert google doc iframe
Of course adding a colored cell to form a triplet with the two cells in T’s
row, but not affecting T would very likely cause other currently colored
cells to become toxic in the process.
Conclusion
I’m going to try code up an algorithm that attempts to produce an optimal single-coloring by trying to make toxic cells as effective as possible, e.g. by looking at where we can add a single colored cell and bridge several ineffective pairs at one time. I’ll also look at some other more conventional search strategies.
My next and hopefully last post on this junk should be of shorter and of more general compsci interest.